 By admin
Why the Economy and the Market Aren't the Same Thing
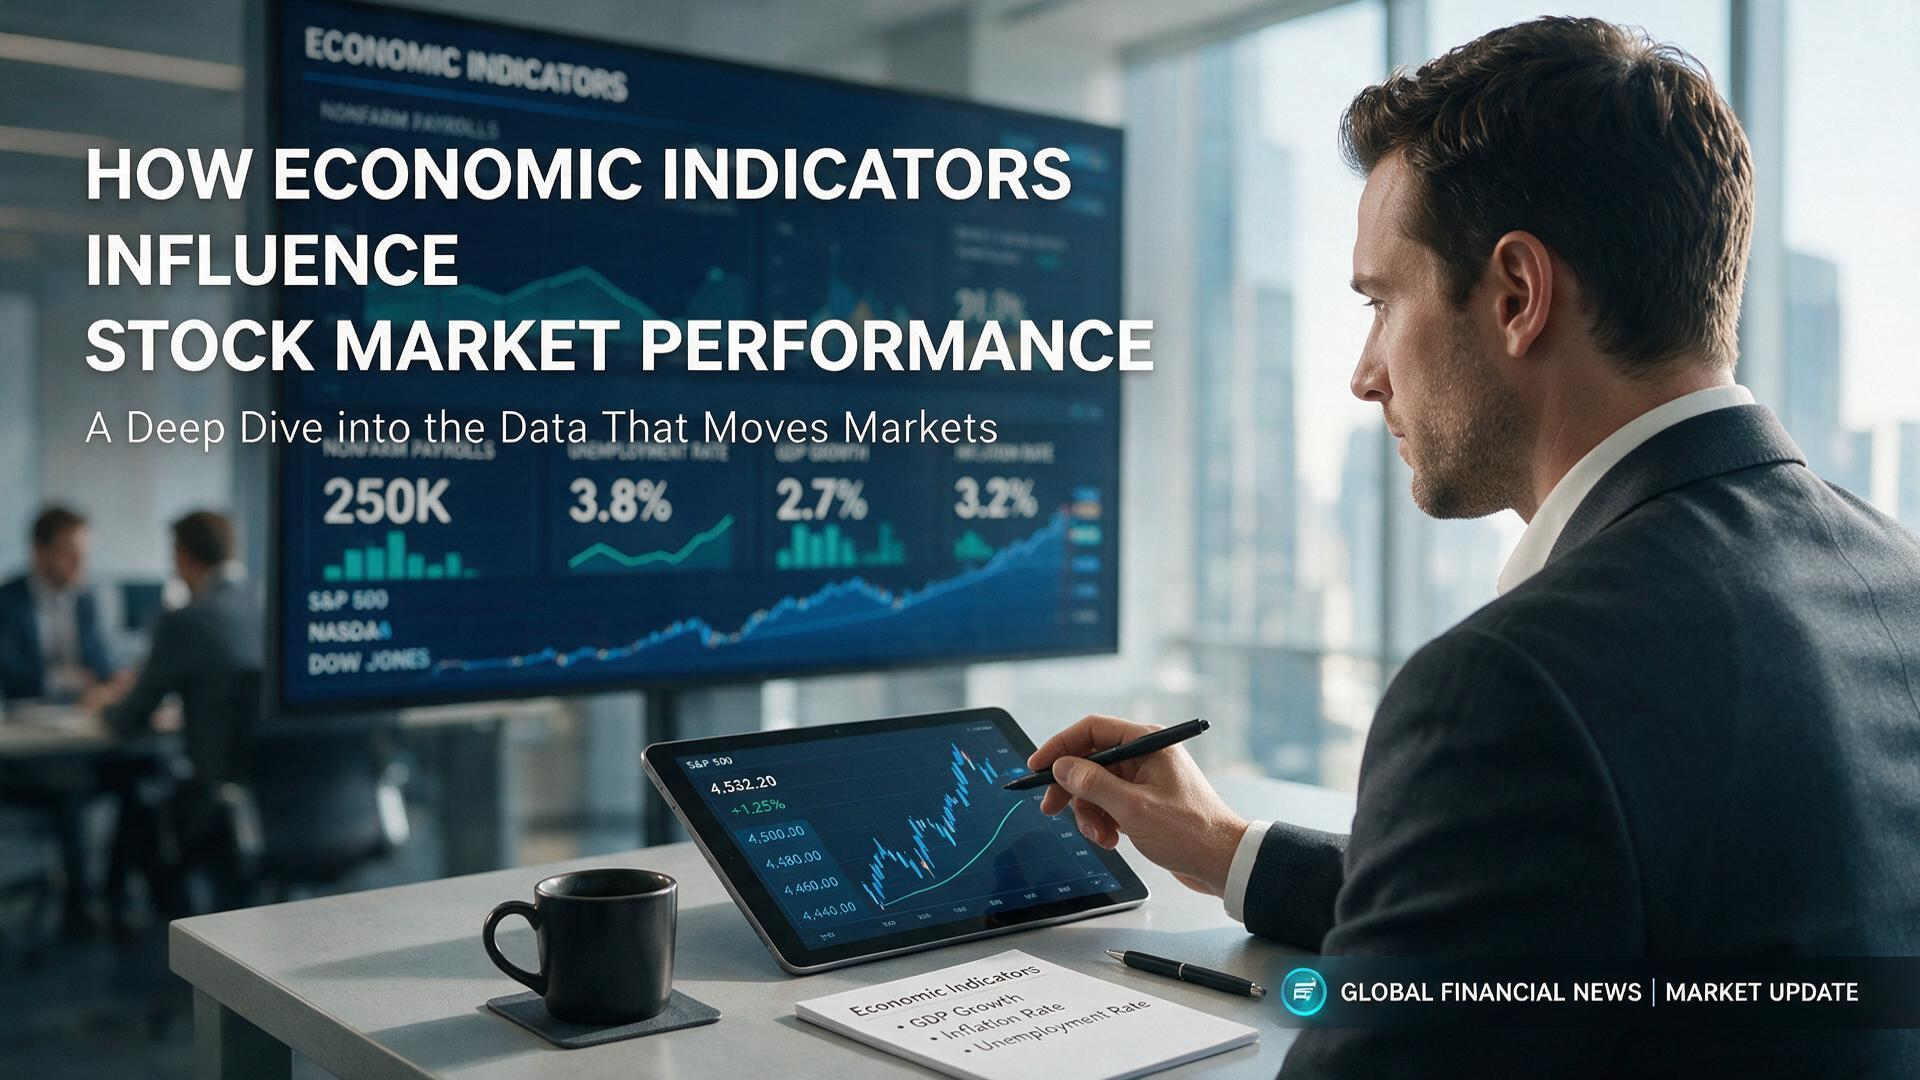
Here's a puzzle that confuses a lot of investors: the economy can be struggling while the stock market soars, and the economy can be booming while stocks fall. If the market were simply a mirror of the economy, that wouldn't happen. But the market isn't a mirror — it's a forward-looking pricing mechanism that reflects what investors expect the future to look like, not what's happening right now. Understanding the connection between economic indicators and stocks is less about predicting the economy and more about understanding how expectations, interest rates, and corporate profits interact. Get that relationship right, and you'll stop being surprised when the market does something that seems to contradict the headlines.
The relationship runs through corporate earnings and discount rates. Stock prices ultimately reflect the present value of future cash flows, which means two things drive them: how much profit companies are expected to generate, and how heavily those future profits are discounted back to today. Economic indicators influence both. Growth figures, employment data, and consumer spending affect earnings expectations, while inflation and central bank policy affect the discount rate. When those two forces move in the same direction, the market responds clearly. When they pull against each other, as they often do, the market's reaction can be confusing. That's why good stock market analysis looks at both sides of the equation rather than fixating on one.
It's also worth remembering that the market is a discounting machine that's already priced in a lot of what everyone knows. A strong jobs report that everyone expected won't move stocks much, while a weaker-than-expected report can send prices sharply higher if investors conclude it means the central bank will ease policy. The reaction depends on the surprise relative to expectations, not the absolute level of the data. This is why experienced investors pay as much attention to consensus forecasts as to the numbers themselves — the gap between what was expected and what actually happened is where the market moves happen.
Interest Rates and the Cost of Money
Of all the forces that shape stock prices, few matter more than interest rates. The relationship between interest rates and equities runs through valuation. When rates rise, the discount rate used to value future cash flows goes up, which means those future earnings are worth less in today's dollars. Growth stocks, whose value is concentrated in earnings far in the future, are especially sensitive to this. Value stocks, which generate more of their cash flow now, tend to hold up better. That's why a sharp move in rates often triggers a rotation between the two styles.
Rates also affect borrowing costs, which ripple through the entire economy. Companies that carry significant debt face higher interest expenses when rates rise, which squeezes their margins and reduces earnings. Consumers feel it too, through higher mortgage rates and credit card payments, which can slow spending and hurt businesses that depend on consumer demand. Real estate, utilities, and other capital-intensive sectors are particularly exposed. On the other hand, banks and financial companies often benefit from higher rates, since they earn more on the spread between what they pay depositors and what they charge borrowers. The effect of a rate change isn't uniform across the market — it creates winners and losers, and understanding which is which is part of the analytical work.
The central bank's role adds another layer of complexity. Markets spend enormous energy trying to anticipate what the Federal Reserve will do next, because policy decisions affect both earnings expectations and discount rates. When the Fed signals that it will cut rates, stocks often rally in anticipation of easier conditions and stronger growth. When it signals a more hawkish stance, stocks can sell off. But the relationship isn't mechanical. If the Fed is cutting rates because the economy is weakening, that's bad news for earnings even if it's good news for valuations. Context matters, and investors who focus only on the direction of rates without considering why they're moving often misread the market's reaction.
It's also worth noting that rate changes affect different parts of the market with different lags. Rate-sensitive sectors like housing and autos may react quickly, while the broader economy takes longer to feel the impact. Long-duration assets like growth stocks can reprice immediately as discount rates change, while dividend-paying value stocks may respond more slowly. Understanding these lags helps explain why the market sometimes seems to react to rate news in ways that don't align with the immediate economic data. The market is pricing in a future that hasn't arrived yet, and the timing of that future matters as much as its direction.

Inflation and What It Does to Stocks
Inflation is another force that reshapes the market landscape, and the relationship between inflation and stock prices is more complicated than it first appears. In the short run, moderate inflation can be a sign of a healthy economy, and stocks often rise as prices and profits grow together. But when inflation runs hot, it forces central banks to raise rates, which compresses valuations and slows growth. The market's reaction depends heavily on whether inflation is seen as transitory or persistent, and whether the central bank is expected to respond aggressively.
Not all companies suffer equally when inflation rises. Businesses with strong pricing power can pass higher costs through to customers and protect their margins. Companies with weak pricing power see their margins squeezed, and their earnings suffer. This is why inflation often triggers a rotation within the stock market, away from companies that can't raise prices and toward those that can. Sectors like consumer staples, energy, and certain industrials often hold up better in inflationary periods, while long-duration growth stocks and companies with heavy debt burdens tend to struggle. Owning a mix of businesses with different sensitivities to inflation is one way to protect a portfolio against this kind of environment.
It's also important to distinguish between expected and unexpected inflation. Markets price in expectations, so if inflation rises roughly in line with what investors anticipated, the reaction may be muted. Surprises are what move prices, and an unexpected jump in inflation can trigger sharp selloffs as investors reprice the future. This is why inflation reports are among the most closely watched data releases. The numbers themselves matter, but the gap between consensus and reality matters just as much. Investors who understand this distinction are less likely to be caught off guard by the market's reaction to an inflation report that seems, on the surface, not that different from the one before.
Over longer time horizons, stocks have historically been one of the better hedges against inflation, because companies can raise prices and earnings tend to grow with the general price level. But that's a long-run property, and it doesn't hold over every period. In the short run, inflation can be painful for equities, especially when it forces aggressive rate hikes. The investors who handle inflationary periods well are the ones who understand the difference between the short run and the long run, and who position their portfolios accordingly rather than reacting to every monthly data point.
Growth, Employment, and Consumer Data
The broadest set of economic market trends comes from growth and employment data. Gross domestic product, the monthly jobs report, retail sales, and consumer confidence all provide clues about the direction of the economy and, by extension, corporate earnings. When growth is strong and employment is healthy, investors tend to expect rising profits, which supports stock prices. When those indicators weaken, expectations for earnings come down, and stocks often follow. The relationship isn't perfect, but it's one of the most reliable backdrops for understanding where the market is likely to go over the medium term.
Employment data deserves special attention because of its dual role. On one hand, strong hiring is a sign of a healthy economy, which is good for earnings. On the other hand, a very tight labor market can drive wage growth and contribute to inflation, which may force the central bank to tighten policy. That's why a strong jobs report sometimes sends stocks lower rather than higher — investors worry that the strength will lead to rate hikes. This tension is a recurring theme in market analysis, and investors who understand it are less likely to be confused by the apparent contradictions in how markets react to economic data.
Consumer data is another key piece of the puzzle. Consumer spending accounts for a large share of the economy, so retail sales, personal income, and consumer confidence all carry weight. When consumers are confident and spending, businesses benefit. When they pull back, the effects ripple through the economy. Consumer sentiment surveys are watched closely because they often turn before actual spending does, making them a useful leading indicator. That said, sentiment doesn't always translate into behavior, and investors who treat every survey as a reliable predictor can be led astray. The data is most useful when it's interpreted in the context of other indicators rather than in isolation.
It's worth remembering that economic data is noisy and subject to revision. Initial readings often change as more information becomes available, and investors who react to every headline can find themselves whipsawed. A more effective approach is to look for trends rather than individual data points, and to keep an eye on the direction of the data rather than obsessing over the latest number. Trends persist, while single data points are often revised away. The investors who do this well tend to be more patient and less reactive, which is usually a good thing when it comes to making decisions about stocks.
Reading the Economy Without Overreacting
The practical challenge for investors is that economic indicators are abundant, constantly updated, and frequently contradictory. One report suggests the economy is slowing, while another suggests it's still growing. One measure of inflation is cooling, while another is still running hot. This noise can be paralyzing if you let it be, which is why a framework for interpreting the data matters more than the data itself. The goal isn't to react to every release but to develop a view of where the economy is heading and to position your portfolio accordingly over time.
One useful approach is to focus on a small set of indicators that have historically been reliable. Growth, inflation, employment, and interest rates cover most of what matters, and tracking those trends is more valuable than following every report that crosses the wire. It's also worth separating indicators that lead from those that lag. The stock market itself is a leading indicator, which is why it sometimes seems to turn before the economy does. Consumer confidence and housing starts often lead, while employment and GDP tend to lag. Knowing which category a data point belongs to helps you interpret it correctly.
Another key is to avoid overreacting to short-term moves. Markets can swing wildly on a single data release, then reverse course a week later when a different report comes out. Investors who trade on every headline often end up with high costs and mediocre returns, because the noise overwhelms the signal. A more measured approach is to make adjustments when the broader trend changes, rather than trying to capitalize on every data point. That means being patient, keeping your portfolio diversified, and accepting that you won't catch every turn. The investors who do well over time tend to be the ones who think in terms of quarters and years, not days and weeks.
Finally, it's worth remembering that economic indicators are tools for understanding the environment, not a crystal ball. They can help you make sense of what's happening and position your portfolio for a range of outcomes, but they can't tell you exactly what the market will do next. The investors who succeed are the ones who use the data to inform their thinking without becoming slaves to it. Stay diversified, keep your costs low, and maintain a long-term perspective — that's the approach that holds up across economic conditions, whatever the latest indicator happens to say.