 By admin
The Simple Question That's Surprisingly Hard to Answer
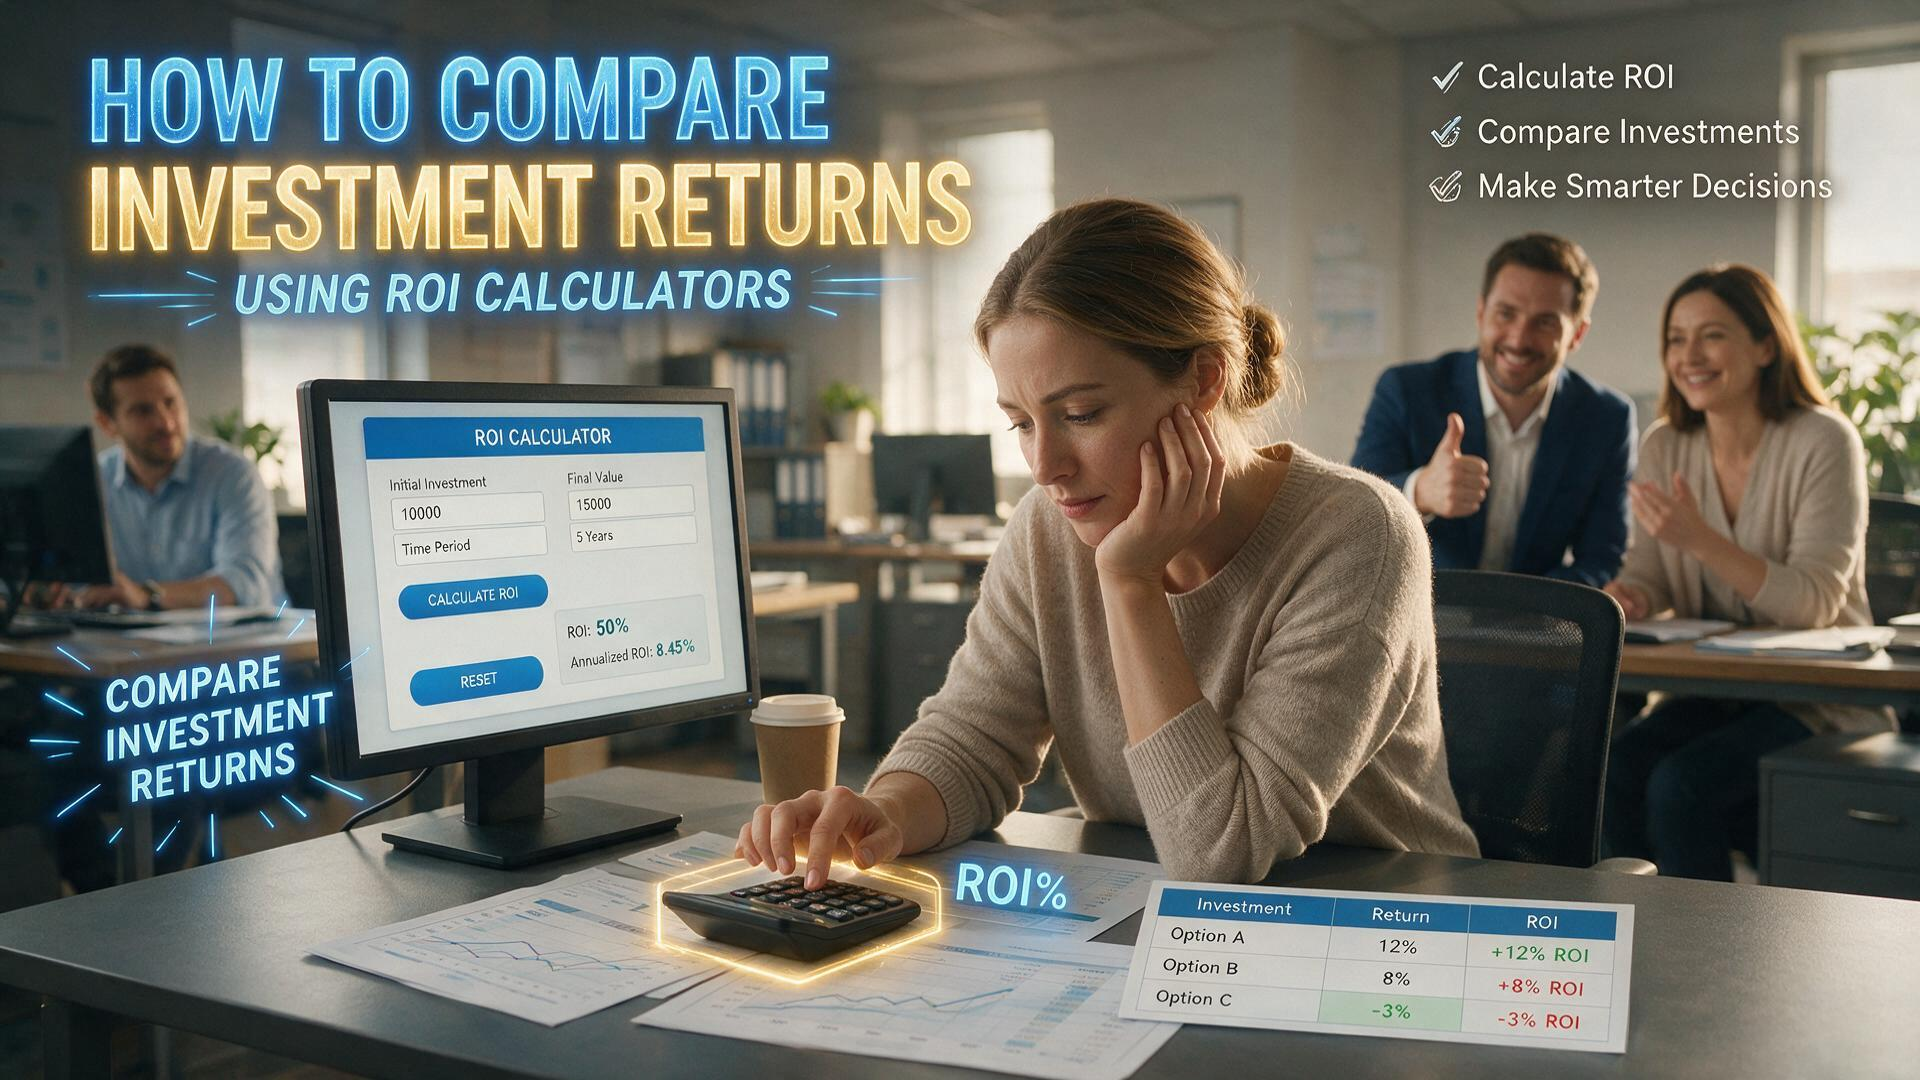
How did your investments do last year? It sounds like a simple question, but most people can't answer it accurately. They know their account balance went up, but they don't know whether that gain came from their contributions, from the market, or from a lucky bet. They know one fund outperformed another, but they don't know whether that's because of skill, risk, or timing. The ROI calculator exists to answer those questions, but using it well requires understanding what return actually means and how to measure it fairly. Without that understanding, you're comparing numbers that aren't comparable, and drawing conclusions that don't hold up.
The core concept of return on investment is simple: it's the gain or loss on an investment relative to the amount invested. If you put in $10,000 and end up with $12,000, your return is 20%. That math is straightforward when there's a single contribution and a single outcome. But real investing involves multiple contributions over time, dividends that get reinvested, fees that reduce returns, and taxes that take a bite. Those complications make the simple calculation misleading, which is why the investment return analysis that actually helps you make decisions is more sophisticated than a basic percentage.
The stakes are higher than they look. If you compare two investments using the wrong measure, you might choose the one that looks better but is actually worse. You might abandon a good strategy because it underperformed in a period when the comparison was unfair. You might attribute gains to skill when they were really just luck. The investment performance tracking that works gets the measurement right first, because a wrong measurement leads to wrong conclusions, and wrong conclusions lead to bad decisions.
Simple ROI and Its Limits
The basic ROI formula is gain divided by cost, usually expressed as a percentage. If you buy a stock for $1,000 and sell it for $1,500, your gain is $500 and your ROI is 50%. If you buy a house for $300,000 and sell it for $350,000, your ROI is about 16.7%. The formula is useful for simple, single-transaction comparisons, and it's a reasonable starting point for understanding whether an investment made money.
But simple ROI has serious limitations when applied to real portfolios. It doesn't account for the time value of money, which means a 10% return over one year and a 10% return over ten years look identical even though they're very different. It doesn't account for the timing of cash flows, which means contributions made at different times are treated as if they were all made at the beginning. It doesn't account for risk, which means a high-return investment that could have lost everything is treated the same as a low-risk investment with the same return. The ROI calculator that handles these complications gives you a more accurate picture, but only if you know which version to use.
Simple ROI is also easy to manipulate, intentionally or not. If you exclude certain costs—fees, taxes, transaction expenses—you can make an investment look better than it actually was. If you choose a favorable time period, you can make a mediocre investment look excellent. The return on investment that's meaningful includes all the relevant costs and covers a fair time period, not just the one that makes the numbers look good.
For comparing investments, simple ROI works best when the investments are similar in duration and structure. If you're comparing two stocks held for the same period, a simple ROI comparison can be informative. If you're comparing a stock held for two years to a bond held for ten, simple ROI will mislead you. The financial decision tools that work are matched to the situation, not applied universally.

Time-Weighted Returns and Money-Weighted Returns
When you're evaluating a portfolio with multiple contributions and withdrawals, you need a more sophisticated measure than simple ROI. The two most common are time-weighted return and money-weighted return, and they answer different questions. Understanding the difference is essential for comparing your performance to benchmarks and for evaluating whether your decisions added value.
Time-weighted return measures the performance of the underlying investments, independent of the timing and size of your contributions. It's calculated by breaking the period into sub-periods between cash flows, calculating the return for each sub-period, and then compounding them together. The result is a measure of how well the investments performed, regardless of when you added or removed money. The investment return analysis that compares your portfolio to a benchmark should use time-weighted return, because that's what the benchmark measures.
Money-weighted return, also called internal rate of return, measures the performance of your actual portfolio, including the effect of your contributions and withdrawals. It's the rate that makes the present value of all your cash flows equal to the present value of your ending balance. If you contributed more before a rally and less before a decline, your money-weighted return will be higher than your time-weighted return, because your timing added value. If you did the opposite, it will be lower. The investment performance tracking that reflects your actual experience should use money-weighted return, because that's what you actually earned.
The distinction matters because the two measures can tell very different stories. A portfolio might have a strong time-weighted return but a weak money-weighted return, because the investor added money at the wrong times. Or the reverse. The ROI calculator you use should be clear about which measure it's calculating, because using the wrong one can lead you to draw the wrong conclusions about your performance.
Adjusting for Risk and Fees
Return without risk adjustment is incomplete. A 15% return on an investment that could have lost 50% is not necessarily better than an 8% return on an investment that could have lost 10%. The risk-adjusted return is what matters, and comparing raw returns without considering risk can lead you to take on more risk than you intended or to abandon a strategy that was actually performing well on a risk-adjusted basis.
The Sharpe ratio is the most common risk-adjusted measure. It subtracts the risk-free rate from the return and divides by the standard deviation of returns. A higher Sharpe ratio means you got more return per unit of risk. The Sortino ratio is a variation that only considers downside volatility, which is closer to how most investors actually experience risk. The investment return analysis that includes these measures gives you a more complete picture than raw return alone.
Fees are the other major adjustment. The return you see quoted is often before fees, which means the return you actually keep is lower. A fund that returns 10% but charges 1.5% leaves you with 8.5%, while a fund that returns 8% but charges 0.05% leaves you with 7.95%. The difference seems small, but it compounds over time. The return on investment that matters is the after-fee return, and comparing funds on pre-fee returns is misleading.
Taxes are another adjustment that's often overlooked. A return of 10% in a taxable account might leave you with 8% after taxes, while the same return in a tax-advantaged account leaves you with the full 10%. The investment performance tracking that includes after-tax returns gives you a more accurate picture of what you're actually earning, especially if you hold investments in both taxable and tax-advantaged accounts.
Using ROI Calculators to Compare Investments
The key to comparing investments fairly is to make sure you're comparing like with like. That means using the same measure for both, covering the same time period, and including the same costs. A comparison between a fund held for three years and a fund held for five years is unfair, because the two periods had different market conditions. A comparison between a high-fee fund and a low-fee fund is unfair if one return is quoted gross and the other net. The financial decision tools that work help you standardize the comparison, but you have to use them consistently.
It's also worth comparing investments to an appropriate benchmark. A stock fund should be compared to a stock index, not to a bond fund. A small-cap fund should be compared to a small-cap index, not to the S&P 500. The ROI calculator can compute the return, but choosing the right benchmark is a judgment call that the calculator can't make for you. Getting the benchmark right is essential, because comparing to the wrong benchmark can make a good investment look bad or a bad one look good.
For long-term investors, the comparison should focus on the long term. A fund that outperformed over one year might underperform over ten, and a fund that had a bad year might have a strong decade. Looking at returns over multiple time periods gives you a more complete picture than looking at a single period. The investment return analysis that considers the full cycle is more useful than one that focuses on the most recent quarter.
Finally, remember that past returns are a starting point for analysis, not a prediction. A high return in the past doesn't guarantee a high return in the future, and a low return doesn't guarantee the reverse. The return on investment is a measure of what happened, not what will happen. Using ROI calculators to compare investments is a valuable exercise, but it has to be combined with an understanding of the underlying investments, the risks involved, and your own goals. The calculator gives you numbers. The judgment is still yours to make.