 By admin
Charts Are Just Pictures of Fear and Greed
A forex chart looks like a simple thing. A line goes up, a line goes down, some candles in between. But what you're actually looking at is a visual record of every decision made by every participant in the market. Every trade, every hedge, every panic, every moment of optimism is captured in that price history. Learning to read it isn't about finding a magic pattern that predicts the future. It's about understanding what the market has done, what it's likely to do next based on past behavior, and where the risks are. That's the foundation of forex chart analysis, and it's the skill that separates traders who react to the market from those who anticipate it.
The charts themselves are just tools. The real work is in the interpretation. A candlestick pattern that looks bullish on one time frame can look bearish on another. A trendline that seems solid can break on a news release. An indicator that's been reliable for weeks can suddenly stop working. The forex technical analysis that actually helps you is not about finding a single signal that tells you what to do. It's about building a mental model of how the market is behaving, what's driving it, and where the balance of risk and reward lies. That model changes as conditions change, and the traders who adapt are the ones who survive.
It's also worth saying that charts don't tell you everything. They don't tell you why a currency is moving, and they don't tell you what's going to happen next. They tell you what has happened and where the market has found support and resistance in the past. That information is useful, but it's not complete. The best forex traders combine chart reading with an understanding of fundamentals, awareness of news events, and a clear-eyed view of their own psychology. Charts are a piece of the puzzle, not the whole picture.
The Building Blocks of Price Charts
Before you can read currency trading charts, you need to understand what's on them. The most common format is the candlestick chart, which shows the open, high, low, and close of each period. The body of the candle shows the difference between the open and close, and the wicks show the extremes. A green or white candle means the close was higher than the open. A red or black candle means the close was lower. That's the basic structure, and it's the foundation for everything else.
Time frames matter enormously. A daily chart shows the big picture, with each candle representing a full day of trading. An hourly chart shows more detail, with each candle representing an hour. A five-minute chart shows even more detail, with each candle representing five minutes. The same price action can look very different depending on the time frame you're looking at. A bullish pattern on a five-minute chart might be a tiny blip on a daily chart. That's why traders usually look at multiple time frames—the higher time frame for context, and the lower time frame for entry and exit timing.
Support and resistance are the other core concept. Support is a price level where buying has previously been strong enough to stop a decline. Resistance is a price level where selling has previously been strong enough to stop a rally. These levels aren't exact, and they're not always respected, but they're useful reference points. When price approaches a support level, traders watch to see whether it holds. If it does, that can be a buying opportunity. If it breaks, it can signal a continuation of the downtrend. The more times a level has been tested, the more significant it is, and the bigger the reaction when it finally breaks.
Trendlines are another visual tool that helps identify direction. An uptrend is a series of higher highs and higher lows. A downtrend is a series of lower highs and lower lows. A trendline connects the highs or lows to show the direction of the trend, and it can help you see when the trend is changing. When a trendline is broken, it's often a sign that the trend is weakening or reversing. Trendlines aren't perfect—they're subjective, and different traders will draw them differently—but they're a useful way to visualize the market's direction.
Identifying Trends and Their Phases
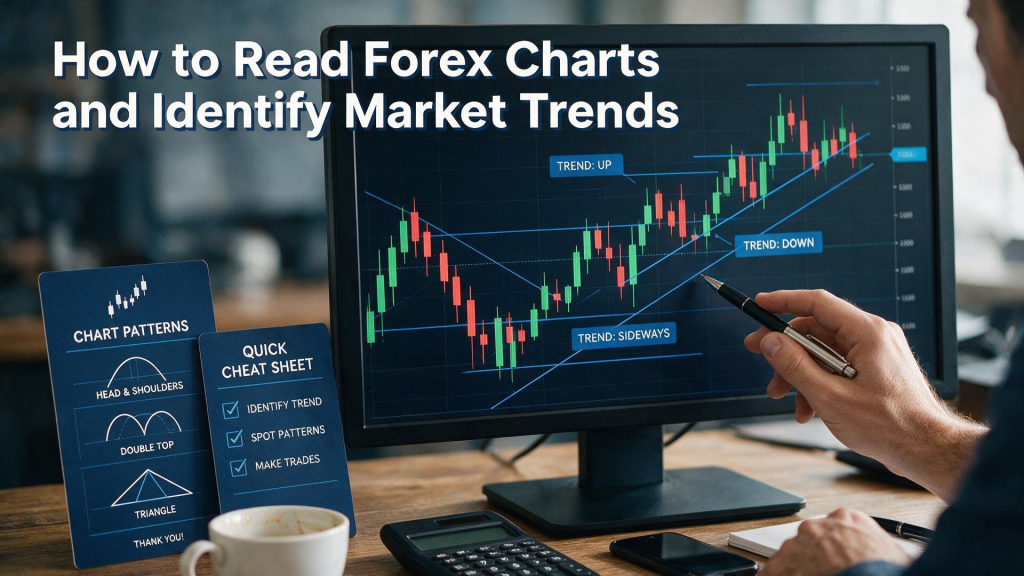
Forex market trends are the foundation of most trading strategies. A trend is simply a sustained direction in price over time. Uptrends, downtrends, and sideways markets are the three main types, and each requires a different approach. In an uptrend, you want to be buying dips. In a downtrend, you want to be selling rallies. In a sideways market, you want to be fading the extremes and waiting for a breakout. Trading against the trend is possible, but it's harder, and the odds are worse.
Trends have phases, and recognizing which phase you're in is a key skill. The accumulation phase is when smart money is buying after a downtrend, and price is range-bound. The markup phase is when the trend becomes obvious and more buyers enter, driving the price higher. The distribution phase is when the smart money is selling to latecomers, and price starts to stall. The markdown phase is when the trend reverses and price falls. These phases aren't always clean, and they don't always unfold in order, but they're a useful framework for thinking about where you are in the cycle. The forex technical analysis that focuses on trend phases is often more effective than trying to pick tops and bottoms.
Trend strength is another important factor. A strong trend is one where price moves in one direction with conviction, and pullbacks are shallow. A weak trend is one where price moves in one direction but with frequent reversals, and pullbacks are deep. The strength of a trend affects how you trade it. In a strong uptrend, you might buy every small dip. In a weak uptrend, you might wait for deeper pullbacks before entering. Moving averages can help you gauge trend strength—when price is consistently above a moving average, the trend is strong; when it's crossing back and forth, the trend is weak.
Trend reversals are the hardest part of trend trading. Recognizing when a trend is ending is more difficult than recognizing when it's continuing, because trends often show false signals before they reverse. Divergence between price and momentum indicators can be a clue, but it can also be a false alarm. Volume can help—reversals often come with a surge in volume—but volume data in forex is less reliable than in stocks. The most reliable approach is to wait for confirmation: a break of a trendline, a break of a key support or resistance level, or a change in the pattern of highs and lows. Confirmation comes at a cost—you give up some of the move—but it reduces the risk of being faked out.
Indicators: Tools, Not Answers
Trading indicators are mathematical calculations based on price and volume that are meant to help you interpret the market. There are hundreds of them, and new ones are invented every year. The temptation is to think that the right indicator will tell you what to do. It won't. Indicators are tools for organizing information, not for predicting the future. The best indicator is the one that helps you see something you'd otherwise miss, and the worst indicator is the one that gives you false confidence.
Moving averages are the most widely used indicator, and for good reason. They smooth out price data to show the underlying trend. A simple moving average is just the average price over a set period, and an exponential moving average gives more weight to recent prices. When price is above its moving average, the trend is up. When it's below, the trend is down. Crossovers—when a shorter moving average crosses above or below a longer one—are often used as signals, though they can be noisy and produce false signals in choppy markets. Moving averages work best in trending markets and poorly in range-bound ones, which is why they should be combined with other tools.
Momentum indicators like the Relative Strength Index and the Moving Average Convergence Divergence are used to gauge whether a move is overextended. The RSI ranges from 0 to 100, and readings above 70 are considered overbought while readings below 30 are considered oversold. The MACD shows the relationship between two moving averages, and crossovers are used as signals. These indicators can be useful, but they're not infallible. An overbought reading in a strong uptrend can persist for weeks, and an oversold reading in a strong downtrend can do the same. Treating overbought or oversold as a sell or buy signal without considering the trend is a common mistake.
The most important thing about indicators is that they're derivative. They're calculated from price, and price is what ultimately matters. An indicator can only tell you something about what price has done, not what it will do. Using too many indicators creates confusion and false confidence, because they often give conflicting signals. Most professional traders use a small number of indicators, and they use them consistently. They don't switch indicators when the market gets difficult. They stick with the tools they understand and interpret them in the context of the broader market picture. That discipline is more valuable than any indicator.
Putting It All Together
Reading charts is a skill that improves with practice. The more time you spend looking at price action, the more you start to recognize patterns and understand what they mean. But practice alone isn't enough. You need a framework, and you need to be consistent in how you apply it. That means picking a set of tools and sticking with them, rather than constantly adding new indicators and changing your approach. It also means being honest about what you don't know, and being willing to sit on your hands when the chart doesn't give you a clear signal.
One useful exercise is to review historical charts and identify what happened after certain patterns or setups. This helps you understand the context in which patterns work and the conditions in which they fail. It's not a perfect predictor, because the future is never exactly like the past, but it builds pattern recognition and helps you develop an intuition for how markets behave. The traders who do this regularly tend to be better at reading live charts, because they've seen these patterns play out many times before.
It's also worth remembering that charts are a tool for managing risk, not just for finding entries. The levels you identify on the chart—support, resistance, trendlines—can serve as natural places to place your stop-losses. If your trade thesis is that price will bounce off support, then a break below support invalidates the thesis, and that's where your stop belongs. Using the chart to define your risk makes your trading more systematic and reduces the role of emotion. It also makes it easier to evaluate your trades afterward, because you can see whether the risk-reward was favorable when you entered.
Finally, keep in mind that no chart analysis is perfect. Markets are driven by human behavior, and human behavior is unpredictable. The best you can do is put the odds in your favor, manage your risk, and accept that some trades will lose. The traders who succeed are the ones who understand this and don't let a losing trade turn into a losing streak. They follow their plan, take their stops, and move on to the next opportunity. That's not glamorous, but it's what works. Charts are a tool for doing that, not a shortcut to guaranteed profits.