 By admin
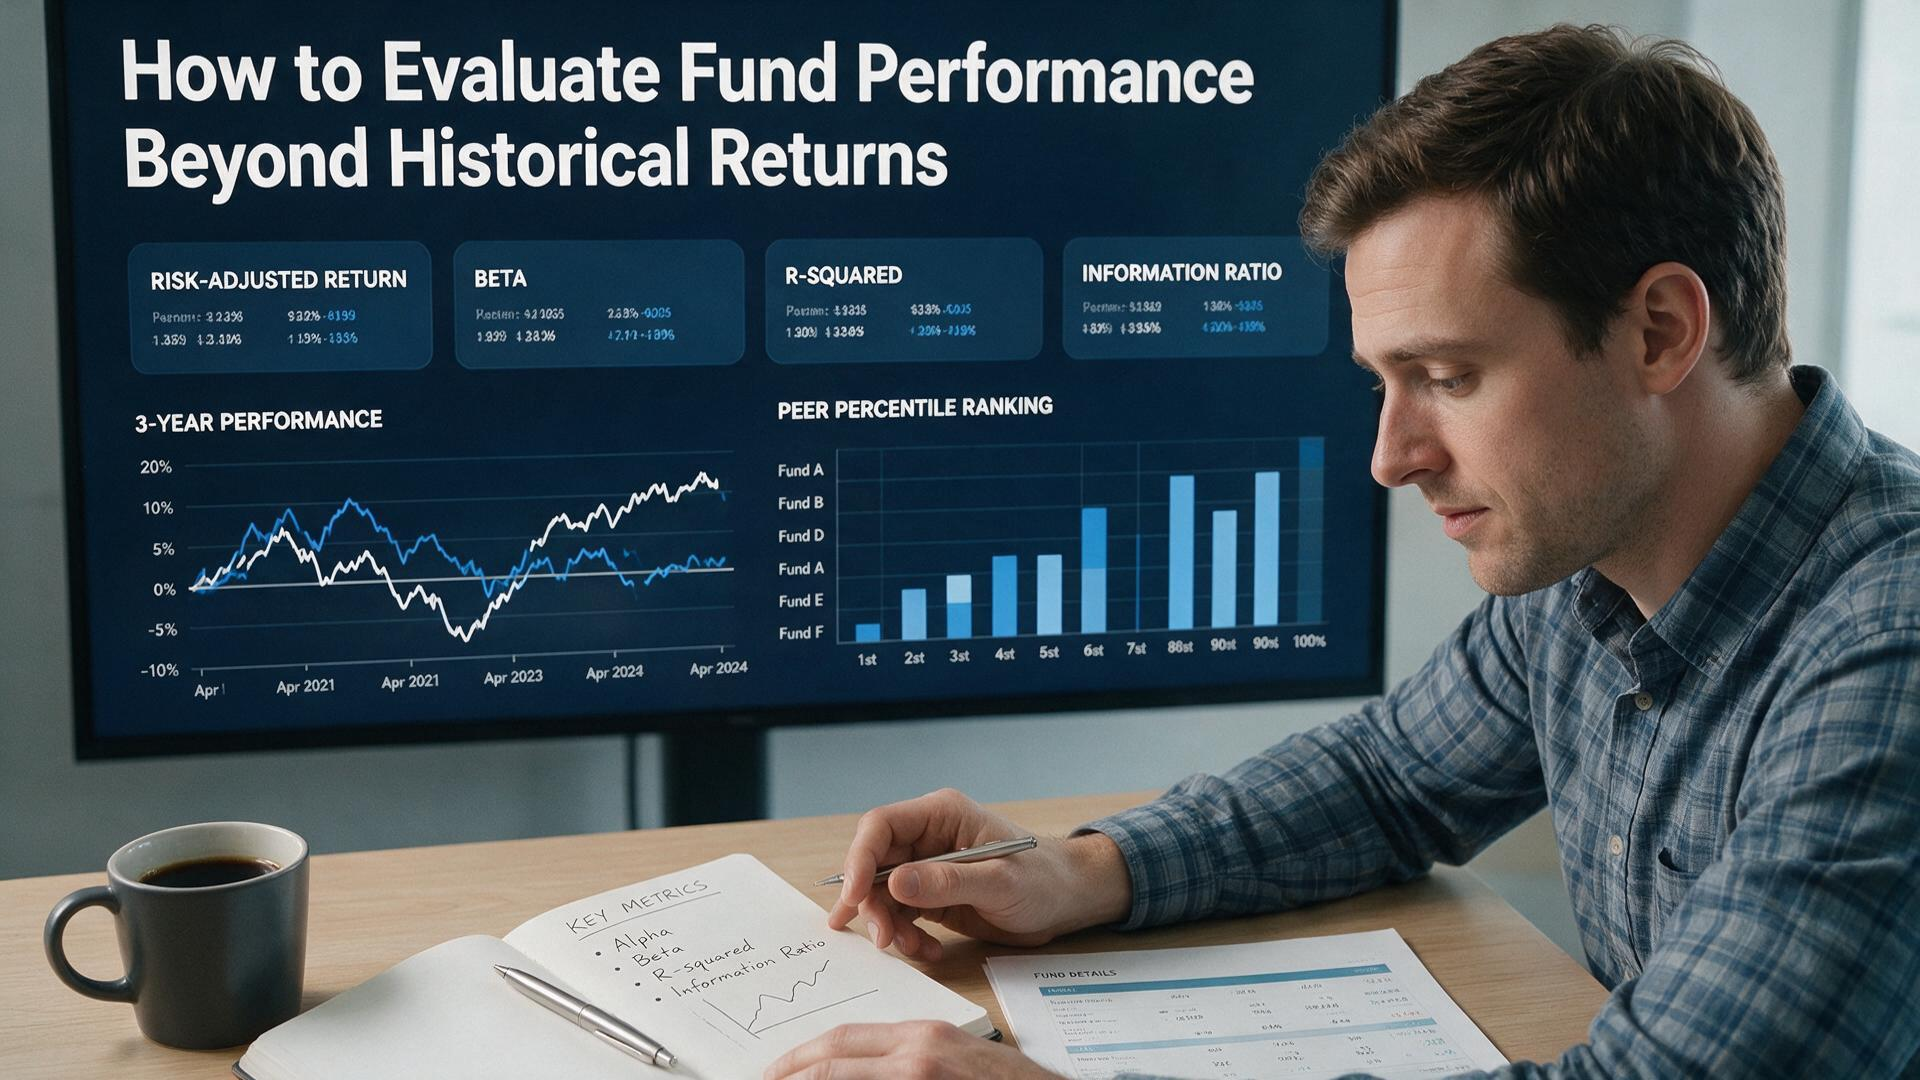
The Number Everyone Looks At Is the Least Useful
Open a fund's fact sheet and the first thing you'll see is its return. One-year, three-year, five-year, ten-year—a row of percentages that seems to tell you everything you need to know. It's the number investors compare, the number fund companies advertise, and the number that drives most purchase decisions. It's also the least reliable guide to future results in the entire document. Fund performance evaluation that stops at historical returns is like judging a restaurant by a single review from a year ago. It might be informative, but it's incomplete in ways that can cost you money.
The reason is that returns are a result, not a cause. They tell you what happened, not why it happened or whether it's likely to happen again. A fund can produce strong returns because of skill, luck, a favorable market environment, a single concentrated bet that paid off, or a strategy that happened to work in that particular period. Without understanding which of those factors drove the performance, you can't tell whether it's repeatable. The mutual fund analysis that matters digs into the drivers of returns, not just the headline number.
There's also a statistical problem. A fund's track record is a sample of one, and samples of one are notoriously unreliable. A manager might have a genuine edge that takes years to show up, or they might have been lucky for a stretch that's about to end. The shorter the track record, the harder it is to distinguish skill from luck. That's why investment fund research should weight long track records more heavily, but even long records can be misleading if the manager or strategy has changed. Past performance is a starting point for questions, not the answer to them.
Risk-Adjusted Returns and What They Reveal
Raw returns don't tell you how much risk was taken to achieve them. A fund that returned 12% by taking enormous risks isn't necessarily better than one that returned 9% with much less volatility. That's why risk adjusted returns matter, and why the metrics that measure them are more informative than the headline number. The Sharpe ratio is the most common, and it measures excess return per unit of volatility. A higher Sharpe ratio means you got more return for the risk you took, which is a better measure of skill than raw return alone.
But the Sharpe ratio has limitations. It treats volatility as the measure of risk, which assumes that returns are normally distributed and that investors care equally about upside and downside volatility. In reality, investors care much more about downside than upside, and returns aren't always normally distributed. Funds that use options, leverage, or concentrated positions can have return distributions that make the Sharpe ratio misleading. The ETF performance metrics that work better for those funds include measures like the Sortino ratio, which only considers downside volatility, and the maximum drawdown, which tells you the worst peak-to-trough loss the fund has experienced.
Alpha and beta are another way to think about performance. Beta measures how much a fund moves relative to the market, and alpha measures the excess return after accounting for that market exposure. A fund with a beta of 1.2 and an alpha of 2% returned 2% more than its beta would predict, which suggests the manager added value. A fund with a beta of 1.0 and an alpha of -1% underperformed the market even though its raw return might look similar to the index. The fund performance evaluation that uses alpha and beta gives you a clearer picture of whether the manager is actually adding value or just taking more risk.
It's also worth looking at performance in different market environments. A fund that shines in bull markets but falls harder than the market in bear markets might be taking more risk than its returns suggest. A fund that holds up better in downturns might be more conservative than its returns indicate. Looking at how a fund performed during specific periods—the 2020 crash, the 2022 rate shock, the 2008 financial crisis—gives you a sense of how it behaves under stress, which is when you most need your investments to hold up. The mutual fund analysis that includes stress testing is more robust than one that only looks at average returns.
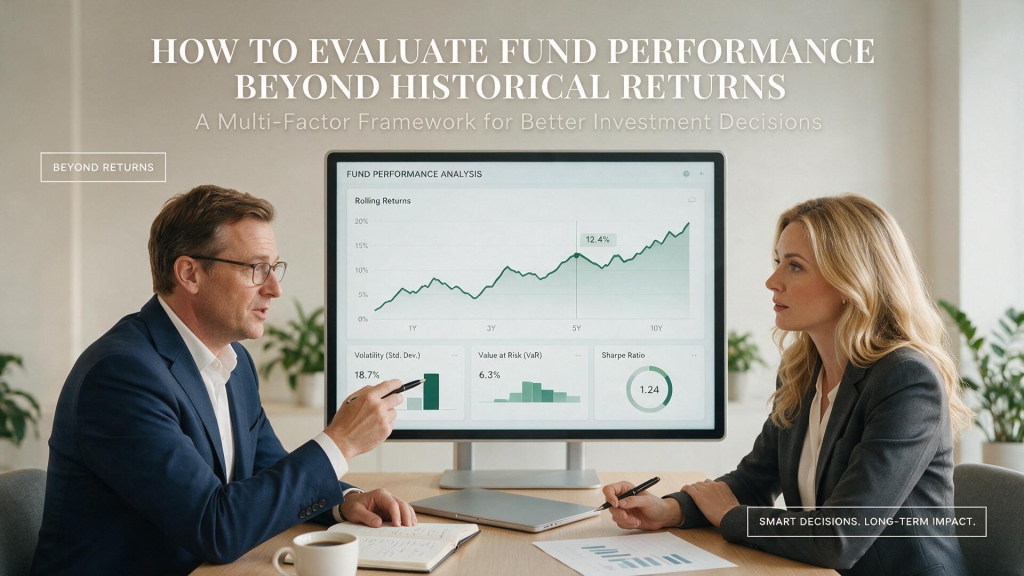
Costs, Taxes, and the Return You Keep
The return a fund reports is before taxes and, in some cases, before all costs. That means the return you actually keep can be significantly lower than the number on the fact sheet. The expense ratio is the most obvious cost, but it's not the only one. Trading costs, bid-ask spreads, and market impact all reduce the fund's returns before the expense ratio is even calculated. A fund with a low expense ratio but high turnover can be more expensive than it looks. The ETF performance metrics that compare reported returns to after-cost returns reveal how much of the headline number is actually reaching investors.
Taxes are the other major drag, especially for funds held in taxable accounts. When a fund sells securities at a profit, it distributes capital gains to shareholders, who owe taxes on those distributions even if they didn't sell any shares. Funds with high turnover generate more taxable distributions than low-turnover funds, which is why tax efficiency is a critical part of performance evaluation. A fund that returns 10% before taxes but distributes large capital gains might leave you with less after taxes than a fund that returns 8% but is tax-efficient. The investment fund research that ignores taxes is missing a major part of the picture.
The timing of returns matters too. A fund that returned 10% over five years but did it with a wildly uneven pattern might be harder to stick with than a fund that returned 9% more steadily. Investors tend to make decisions based on recent performance, and a fund that has a bad year after a good stretch can test the patience of even disciplined investors. Looking at the pattern of returns, not just the average, gives you a sense of whether the fund is one you can hold through the bad times. The risk adjusted returns that consider the path, not just the endpoint, are more useful for real-world decision-making.
It's also worth understanding that reported returns can be affected by survivorship bias. Funds that performed poorly often close or merge, and their returns disappear from the track record. That means the average return of surviving funds is higher than the average return of all funds that existed, which can overstate the performance of the category as a whole. The fund performance evaluation that accounts for survivorship bias gives you a more realistic picture of what you can expect from a fund category, and that's especially important when you're comparing active managers to index funds.
Manager, Strategy, and Consistency
The manager is one of the most important factors in active fund performance, and their tenure matters as much as their track record. A fund's record only tells you something about the future if the people who produced it are still running the fund. If a manager has been in place for ten years, their record is meaningful. If the manager changed two years ago, the ten-year record is mostly irrelevant, because the decisions that produced it were made by someone else. The mutual fund analysis that checks manager tenure is more useful than one that only looks at returns.
The strategy matters too. A fund that describes itself as value but has been buying growth stocks isn't doing what it says, and its returns might not be repeatable if the manager reverts to the stated strategy. A fund that's made a big sector bet that paid off might have a strong record, but the bet might not be repeatable. Understanding what the fund actually does—its holdings, its process, its decision-making—is essential for evaluating whether its returns are a result of skill or a lucky bet. The investment fund research that reads the prospectus and looks at holdings is more informative than one that just reads the fact sheet.
Consistency is another signal. A fund that has beaten its benchmark steadily over many years, with a consistent process, is more likely to continue than a fund that has one great year followed by several poor ones. Consistency doesn't guarantee future success, but it suggests that the manager has a repeatable edge. A fund that changes strategy, holdings, or style frequently might be chasing performance, which is a red flag. The risk adjusted returns that are consistent over time are more meaningful than returns that are volatile and unpredictable.
Finally, consider the fund's size. Very large funds can struggle to find enough opportunities to deploy their capital, which can drag on returns. Very small funds may not have enough assets to operate efficiently, and they can be more vulnerable to closure. The ETF performance metrics that include fund size give you a sense of whether the fund has the scale to operate efficiently and the flexibility to invest opportunistically. Mid-sized funds often hit a sweet spot, with enough assets to be efficient and enough flexibility to take advantage of opportunities that larger funds can't.
Building a Framework for Evaluation
A good evaluation framework starts with the fund's mandate and compares its performance to the right benchmark. A large-cap growth fund should be compared to a large-cap growth index, not to the S&P 500. A bond fund should be compared to a bond index with similar duration and credit quality. Comparing a fund to the wrong benchmark can make it look better or worse than it actually is. The fund performance evaluation that uses the right benchmark is the foundation for everything else.
Next, look at performance over multiple time periods and in different market environments. A fund that has beaten its benchmark over one, three, five, and ten years is more impressive than one that has only beaten it in a single period. A fund that has held up in both bull and bear markets is more robust than one that only shines in good times. The mutual fund analysis that considers the full cycle is more useful than one that only looks at recent returns.
Then, dig into the costs, taxes, and risk-adjusted metrics. A fund with strong returns but high costs and high taxes might not be as good as it looks. A fund with lower returns but better risk-adjusted performance might be a better choice for a long-term investor. The ETF performance metrics that combine returns, risk, and costs give you a more complete picture of whether a fund is worth owning. It's not about finding the fund with the highest return. It's about finding the fund that offers the best combination of return, risk, and cost for your specific situation.
Finally, be honest about what you can and can't know. Past performance is a useful starting point, but it's not a guarantee. Manager skill is hard to distinguish from luck, and even the best managers have bad years. The investment fund research that acknowledges these limitations is more useful than one that pretends to have all the answers. The investors who do best are the ones who use evaluation as a tool for making informed decisions, not as a way to predict the future with certainty. They understand that the goal isn't to find the perfect fund. It's to find a fund that's good enough, at a reasonable cost, that they can hold for the long term and let compounding do the work.